Open Source
PolyGraph
A graph and plotting canvas built from bare Win32 and Direct2D, with everything except the plotting itself already done. Made for people who build their own graphs in WinAPI and want a head start.
Install
git clone https://github.com/AmashOnBlitz/PolyGraph.gitA lot of people try to build graphs and plots in plain WinAPI, and it is a lot of work before you even draw your first curve. I did the same, and PolyGraph is the large chunk of code I wrote along the way. It is pure C++, Win32 and Direct2D, with no UI library and no charting library.
It started as a polynomial graph plotter, a learn-by-building project where I tried to keep the code as clean and structured as I could. Right now you get a window with a grid, the axes with numbers, two lines that follow your mouse, a small box that shows the coordinates under the cursor, and a side panel with a few checkboxes.
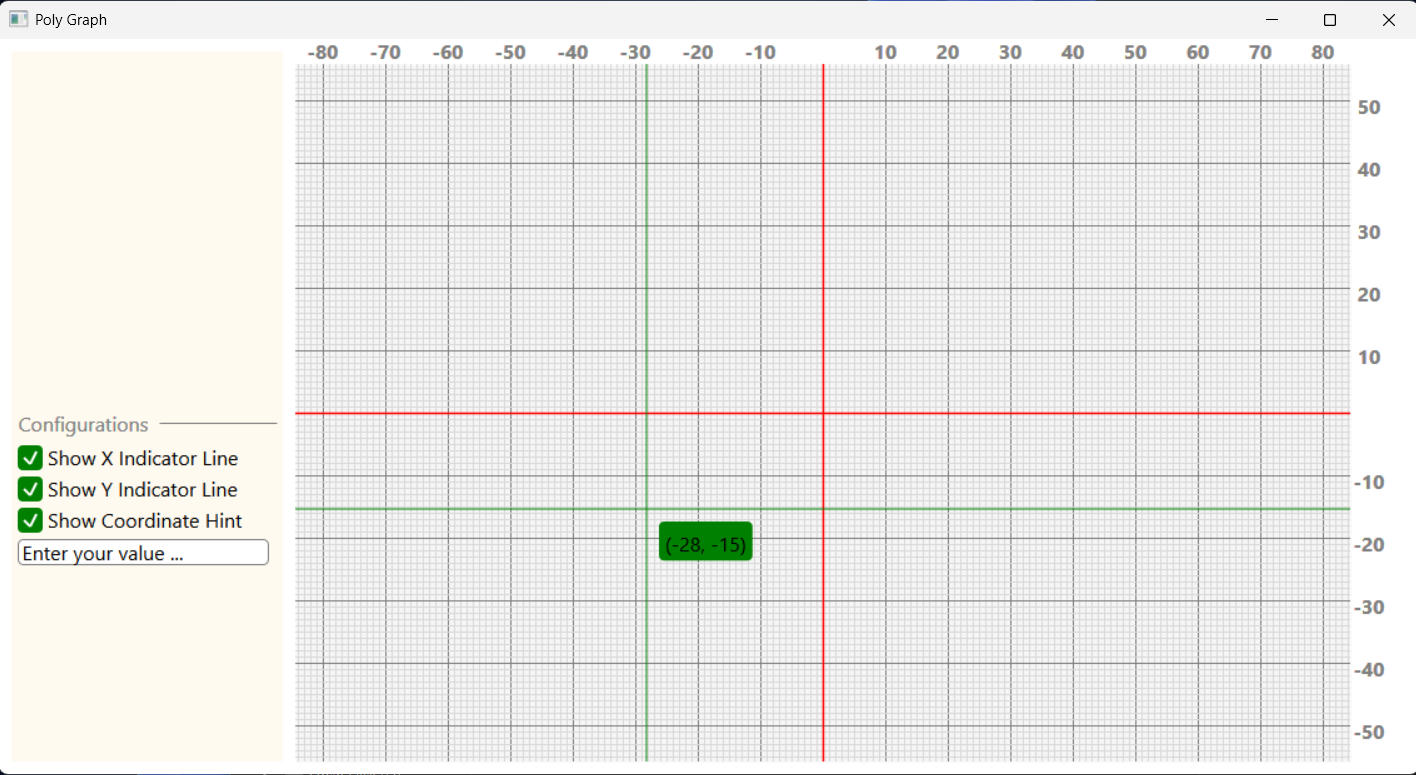
What is done
- The window, message loop, resizing and repainting, all in plain Win32.
- Direct2D and DirectWrite setup for drawing shapes and text.
- The axes, grid lines and numbers on all four sides. Scale, spacing and colours can be changed from the Graph class.
- The two lines that follow the mouse, and the box showing the coordinates.
- The side panel, with checkboxes to turn those things on and off.
- A CheckBox and a DigitBox widget. Each one has a blueprint class that holds its size, colours and text.
What is left
The plotting. The base is built so that plotting can be added on top without tearing anything apart.
Render() in graphics.cpp draws the graph, then the coordinate box, then the side panel. A new RendPlot function called right after RendGraph would draw the curve over the grid.
The graph area is gf_xStart, gf_xEnd, gf_yStart and gf_yEnd, and the middle is gf_xMid and gf_yMid. To turn a pixel into a graph value, RendCoordHint already does it like this:
graphX = (px - gf_xMid) * ScaleX / GridSpace
graphY = (gf_yMid - py) * ScaleY / GridSpace
The polynomial itself can live in the Graph class, as a list of coefficients. The DigitBox is meant for typing them in, but it does not take typed input yet. The key handling in CharKeyDown and SpclKeyDown is still a TODO.
The plot function would go through each pixel column of the graph, turn it into an x value, work out y, turn that back into a pixel, and draw a line from the last point.
How to build
git clone https://github.com/AmashOnBlitz/PolyGraph.gitOpen GraphOne.slnx in Visual Studio and build for x64, Debug or Release. I used
a recent Visual Studio (the project uses toolset v145). Only x64 is set up, so
the x86 configurations will not build.
If you want to use g++ (MinGW-w64), run this from the repo root:
g++ -std=c++20 -O2 -DUNICODE -D_UNICODE -include cmath -include pch.h -IGraphOne/Widgets -IGraphOne/Include -IGraphOne/Pch GraphOne/src/main.cpp GraphOne/src/App.cpp GraphOne/src/graph.cpp GraphOne/src/graphics.cpp GraphOne/Widgets/CheckBox.cpp GraphOne/Widgets/CheckBoxBlueprint.cpp GraphOne/Widgets/DigitBox.cpp GraphOne/Widgets/DigitBoxBlueprint.cpp -o PolyGraph.exe -mwindows -static -ld2d1 -ldwrite -luuidWant to add the plot part?
Please do. If you add plotting, send it back to me so I can update my own code with it. You can:
- open a pull request on GitHub
- or mail me at [email protected]
I might add the plot function myself later, but no promises, hence the paused status.
Good to know
- Built for learning, so some parts may be rough.
- Windows only, since it is Win32.
- The text uses the font “SF Pro Text”. If you don’t have it, Windows picks another one and the text may look a bit different.
- It is under the MIT license, so you can reuse it.